
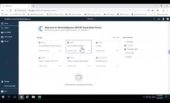
Solution Demos
Search Demos
Posted on Jul 17, 2019
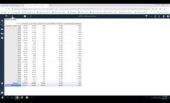
This demo clip shows how to work with pre-created income statement reports in IBM Cognos Analytics with NI’s SAP B1 Quickstart and Financial Reporting add-on module. We first look at an actual versus budget income statement and then at a report showing debits and credits for a specific period, showing how you can filter on marketing expenses, broken down by GL account, and how to add additional information to the report.
Posted on Jul 17, 2019
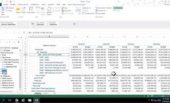
This demo shows how you can explore GL income statement and balance sheet information in Excel such as GL Periods, Chart of Accounts, Versions (Actual versus Budget) and GL measures using our SAP B1 QuickStart solution and our new Financial Reporting add-on module.
Posted on Jun 11, 2019
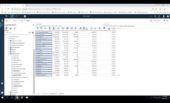
This demo clip shows how to interact using NI's SAP B1 QuickStart with a pre-created commissions report on a specific item family, by salesperson, by customer group and by invoice. It shows how you can add measures like sales quantity, charges, discounts and bill-to customer group to this pre-created report and then demonstrates how to get a summary of all customer groups broken down by commissions .
Posted on Jun 11, 2019
This demo shows how to create a new cross-tab report on net sales, gross profits and commissions by salesperson, how to do calculations on these measures. It then shows how to nest 'ship to groups' and drill down on that information by rep right down to a specific customer.
Posted on Jun 11, 2019
This demo shows how to create a dashboard on commissions information with NewIntelligence's SAP B1 QuickStart Solution. It shows how to add measures like gross profit and net sales & filter on item family and bill to customer group. It also shows how to choose 2 measures to visualize commissions by sales people in a bar graph and then change your visualization to a word cloud to interact further with the information displayed.