What’s New & What Stays in the new release?
Cognos Analytics, released at the end of December 2015, offers the same functionality available in Cognos 10, but with a new and improved interface and user experience mirrored after the same self-service design principles as Watson Analytics.
When you upgrade, users will still be able to access and navigate to all of the current studios within Cognos Analytics just as they were in Cognos 10. The studios easily open in a new browser window with just a click of a button.
The following items remain as is without a planned replacement in this release:
- Workspace
- Query Studio
- Analysis Studio
- Map Manager
- Dynamic Cubes
- Cube Designer
- Framework Manager
- PowerPlay
- Transformer
Future releases may include the following items:
- Ability to report off of multiple Framework Manager packages
- User Interface profiles
- Customization of templates
- Built in functionality to replace Analysis and Query Studios (look for these to be deprecated at a future date)
Here are the top 12 reasons to move to Cognos Analytics :
- Smarter Self-Service
Cognos Analytics aims to address the need for autonomous analytics for business users within an enterprise environment by allowing business users the ability to upload, analyze and even join their data to corporate data managed by IT. “One version of the truth” still remains, since analysis easily moves from ad-hoc to enterprise-wide reporting without the need for a separate “enterprise BI” solution to share data throughout the organization.
In Cognos 10, Report Studio and Cognos Workspace Advanced are simply profiles atop a single studio technology. In Cognos Analytics the studio has been upgraded with a new user experience accessible via the portal new report menu or by editing a report. Authoring replaces Cognos 10 Report Studio and Cognos Workspace Advanced, as it now has all of the capabilities of both combined.
Generally, any user entitled to create or consume reports in Cognos BI is also entitled to create reports, dashboards and data modules in Cognos Analytics. The new authoring experience is well suited to creating a report that will be consumed by thousands of other people, as well as creating ad hoc reports for exclusively your own, perhaps temporary, usage.
2 – New Intuitive User Interface
A complete overhaul of the user interface offers an easy-to-use analytics environment that allows both “data discovery” and “traditional BI” all in one place.
Cognos Connection has been replaced with a clean and modern ‘portal’ that features a sliding panel ‘content explorer’. Public Folders and My Folders have been replaced with My Content and Team Content. The speed of the search function has been greatly improved as it searches as you type. Icons for properties and studios have been replaced with a simple ellipses icon. Consumers are now able to subscribe to a report on a regular schedule, which creates a report view in their My Content folder according to the schedule they choose.
3- Dashboard Creation
The dashboarding capability of the Cognos solution has been completely overhauled and provides the ability to just drag and drop data onto the screen to see the visualization change to suit the analysis. Dashboard creation on the fly gives your users faster access to information, thereby increasing productivity and improving your ROI on your BI solution. Not only is dashboarding easy to use, it produces visually appealing dashboards.
4 – Intent-Driven Modeling based on selected data
The new web based modeling capability allows LOB users to connect to tables or flat files and perform basic data modelling. Web based modeling creates a Data Module which is similar in concept to a Framework Manager package but uses Watson Analytics technology to allow ‘intent-based modelling’, meaning a user can type their interest (e.g ‘Revenue’) and the tool will search for that text and return relevant information. These models can then be shared. A Snapshot function is now available, which allows users to create slices of historical data on the local disk.
Data Modules do not operate as folders the way Framework Manager packages do and cannot include dimensional data sources such as TM1, Dynamic Cubes or any other type of OLAP/cube technology. Data Modules do not replace Framework Manager or Cube Designer, which remain the IT centric modeling interfaces and continue to be supported. Data Modules can be used in both dashboards and reports. Dashboards can be assembled from multiple data modules.
5 – Easy Implementation
Cognos Analytics remains the fastest BI tool to implement at an enterprise level available in the market today. The solution can be deployed over the cloud (described below) or on-premises. The solution’s multi-tiered architecture, scalability and configurability have been the solution’s main differentiators since its inception.
6 – Cloud
Cognos Analytics is now available as a service on the cloud so it is even easier to get up and running. IBM has data centers all around the world, including Canada. You can connect to on-premises data sources, and if you are willing to move your data into the cloud (IBM offers dashDB in the cloud) this can offer you optimal performance.
7 – Analytics – wherever, whenever you need them
The mobile app for Cognos BI has always been at the top of the class with its high level of security, dashboards and the ability to have the same reports both your desktop and mobile device without having to rewrite them (versus some other solutions where reports have to be re-authored in order to be consumed over a mobile device). The biggest change in Cognos Analytics is you can now author reports your mobile device.
8 – Event Studio
Event Studio is still available in Cognos Analytics, and still reflects the Cognos 10 user experience. Find out more about what Event Studio can do here.
Event Studio does not appear by default in a new install but appears as per capabilities for upgraded systems.
9 – Limited and Fully Interactive Reports
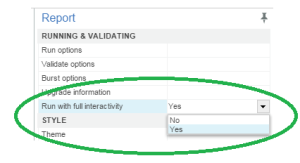
Reports can run in limited interactivity or full interactivity mode. Any report can be set to either mode by the author using the ‘Run with full interactivity’ Report Property:
By default, new reports are fully interactive (‘Run with full interactivity default’ to ‘Yes’). The author can limit the interactivity by setting ‘Run with full interactivity’ to ‘No’.
By default, existing C10 reports run with limited interactivity (‘Run with full interactivity’ = ‘No’) to ensure the reports have the same behavior as the previous release. The author is able to set them to full interactivity (‘Run with full interactivity’ = Yes).
10 – Active Reports as Prompts
A new authoring capability allows you to use an Active Report in the same way that prompts are used. Active Reports offer advantages such as faster time to display the “prompts” as one can schedule the Active Report to run overnight.
This is also a great way to use a live data report to provide real-time data as a “drill through” from a pre-run Active Report.
11 – Upload Data Files
The new Upload Files option in the portal provides a new, faster, more scalable way to upload local data files. The new Upload File capability stores data from delimited text and Excel files in a high-speed columnar storage format on the file system rather than in-memory or in an RDBMS. The new Upload File capability does not generate a separate model/package that has to be managed by the user.
Uploaded files are immediately useable in Dashboards. To use uploaded files in reports, they must first be modeled into a Data Module. You can join two uploaded files by creating a Data Module using the uploaded files as sources.
12 – You can try it for free!
A free trial is available here.
To learn how this one integrated analytics platform can create a more nimble, responsive organization that can anticipate changes and act accordingly, reach out to NewIntelligence today for more details on Cognos Analytics.
To get more information on migrating from your current Cognos version to Cognos Analytics, contact NewIntelligence to consult with one of our experts.


Recent Comments