Here are some highlights of the new release of Cognos Analytics (available since December 2017), which focus on reducing time and effort and strengthening the integration with Planning Analytics:
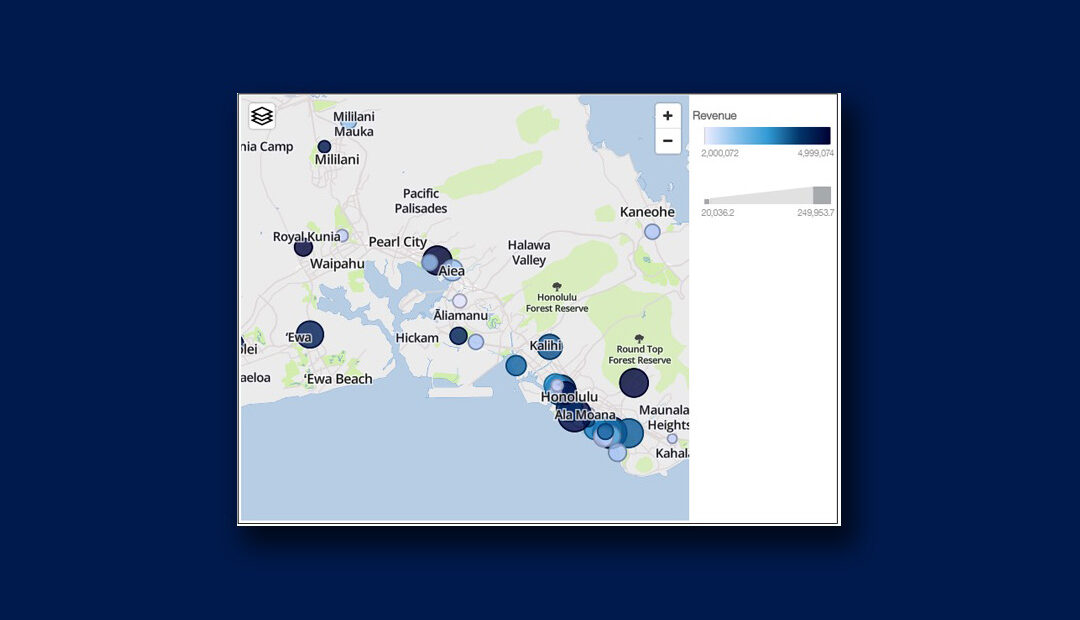
Latitude/Longitude Feature in Dashboards
When using a map in a dashboard, you can display data related to a location, whether with a filled region, a point, a latitude/longitude point, or a combination of these elements.
Fullscreen Mode in Dashboards
The ability to completely hide the top and side panels in a dashboard has been added to optimize the available space.
Reporting Enhancements – Support for Functions in Data Modules
You can now apply your favorite functions to a data module just as you would for any other data source.
Improved Integration with Planning Analytics – Support for Subsets
You can reuse subsets developed by your TM1/PA modeler instead of recreating MDX queries to replicate the query in your BI environment. This feature is available in both dashboards and reports. You can use the subset as a filter or context for any visualization in a dashboard.
Support for Microsoft Office 11.0.0 – Improved Third-Party Integration
R9 incorporates a more official version of the patch group that R8 included to support MS Office. Reports can now be viewed using MS Office, including PowerPoint, Word, and Excel – previously available with Cognos 8 and 10 and updated to work under CA.
IBM continues to address user enhancement requests to ensure that all functions that Cognos 10 users employ and have become accustomed to are present in Cognos Analytics. Visit the Business Analytics Enhancement Requests Community page to see the list of user-submitted requests for upcoming CA versions and vote for the features you would like to see!
For a deeper dive into the new capabilities available in this latest release, read our blog Highlights of #Cognos Analytics version 9 (11.0.9).