Here is a list of notable new and changed features in Cognos Analytics Release 11.1.5 that was released in December 2019:
Getting Started
Members in the metadata tree (in Dashboards, Stories, Explorations, and Data Modules) – now includes members in both relational and dimensional sources.
For relational sources, each unique value in a column is shown as a member in the metadata tree. For dimensional sources, hierarchies and levels can be expanded to view members.
Users can drag members to the canvas to build visualizations just like they drag columns from relational sources. Only members that the user has permissions to view are available in the data tree.
Shared location for uploaded files – Administrators can specify a default, shared location in Team content for uploaded files at the role, tenant, and global levels.
Share saved report output as an email attachment
Dashboards
Display members in the data tree (also available in Forecasting, Modeling) – In Selected sources panel, members are organized into a data tree structure, with parent and child members. Now you can show or hide all levels of the hierarchy, including child members. You can also search for members and configure properties for members.
Drill through from a dashboard to another dashboard – The values you select to drill through from are passed as global filters to the target dashboard.
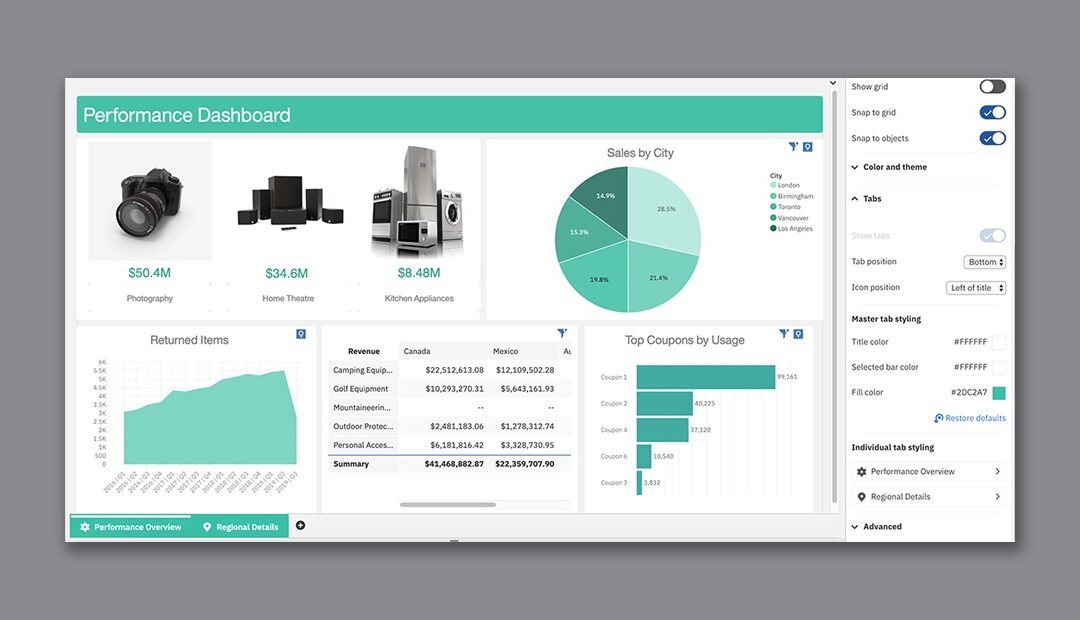
Customize tabs – Customize tab styling for individual tabs or for all the tabs in your dashboard. Move the
tabs to the top, left, bottom, or right of your dashboard and add icons to your tabs.
Show or hide rows and columns in a crosstab – while the Summary rows maintain their value.
Customize how missing values are displayed in your visualizations.
Assistant-suggested questions based on context – Suggestions are based on the context of your data source and particular industry. Before requesting suggestions, you must select a data source to set the context.
New URL for downloading the custom visualization command line tools (also available in Reporting)
Custom visualizations support nested and hierarchical categories (also available in Reporting)
Enhancements for forecasting (also available in Forecasting) – The enhanced forecasting algorithms were evaluated on over 2,000 data sets and there was a 20% increase in accuracy, compared to the previous algorithms.
Searching and zooming in a map (also available in Reporting) – you can search and automatically zoom into items that are matched on your maps. For example, small regions that are spread over a large area.
Refreshing a custom visualization in preview mode in Dashboard
Forecasting
Perform multiple requests concurrently – As you interact with the relationship diagram. Each request that you submit is now managed and cached independently.
While your requests are processed in the background, you can choose another field to focus on in the relationship diagram or create a new card.
Reporting
Schematics – Schematics are visualizations that can map data directly onto an arbitrary graphic representation.
Schematics can, for example be floor plans, seating arrangements, mechanical drawings, or schematic geographical representations.
Legends are more compact in PDF and reports
Modeling
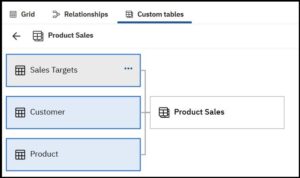
Custom tables – created from tables that exist in the data module. The term “custom table” is new in this release, but the functionality to create new tables in data modules existed in previous versions of Cognos Analytics.
This functionality was enhanced by the introduction of the Custom tables tab that provides a central view for creating, viewing, and managing custom tables in a data module. The tab includes the custom table diagram that shows the tables that were used to create the custom table. The following graphic is an example of a custom table diagram.
Showing the query information – Modelers can view the query information (SQL) for tables and relationships. The query information can be viewed as Cognos SQL, Native SQL, and Query response.
Generating the query SQL – You can specify how Cognos Analytics generates the SQL that retrieves data from tables.
Redesigned user experience for intent modeling – When adding tables to a data module, you can engage the system to suggest the most appropriate tables for your module. The selection of tables is based on keywords that you select. Starting with this release, the keywords are visualized using an interactive word cloud. The user interface for creating a data module proposal includes a confidence score that reflects, in percentages, the predicted ability of the proposal to fulfill your modeling objective.
Samples
New location for Cognos Analytics base samples
The base samples are now organized into three categories:
- Team content > Samples > By business function
- Team content > Samples > By feature
- Team content > Samples > By industry
Administration
Cloud storage for reports – You can configure Cognos Analytics to connect to an external cloud storage environment, allowing users to save their reports securely to the cloud.
New capabilities in 11.1.5
Two new capabilities are available in 11.1.5: AI and Save to Cloud:
- The AI capability allows designated users to access AI functionality. Use Assistant, an associated secured function, allows users to access the embedded Assistant. Users can then ask questions and gain insights about their data.
- The Save to Cloud capability allows users to save their report output to the cloud. A related secured function for Directory Administrators, Manage Connections, provides the ability to create and manage connections to external Cloud Object Storage services.
You can read our latest blog to get all the details on the key enhancements of this new release and to find out more about how NewIntelligence can help you with migrating to Cognos Analytics 11.1.5.