This Fall saw the release of the much-anticipated release of Cognos Analytics 11.1.4. This new version has many new features and improvements.
Here is a summary of the best of what’s new in this new release:
Getting Started
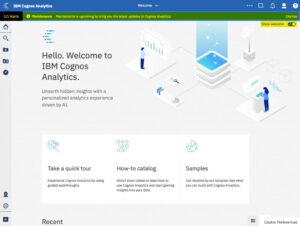
A new welcome screen that has been designed for both new and existing users alike. New users now have access to some new guided quick tours to help them get started and access samples that will help guide and improve their understanding & productivity. Existing users can now toggle between the classic tile view of recent content or list view of tagged content.
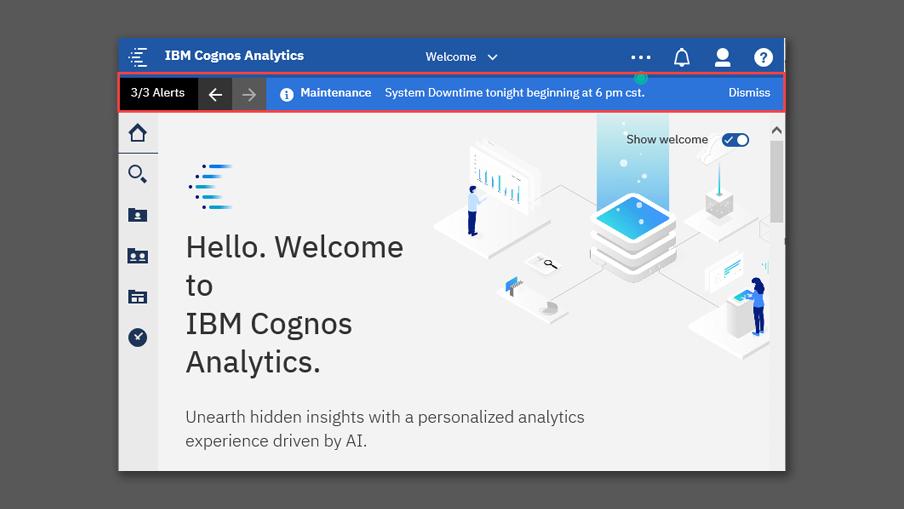
Administrators can customize a message in an alerts banner, such as an upcoming maintenance announcement.
Custom Visualizations
Cognos has been offering the ability to create custom visualisations for many years now (remember the introduction of RAVE a few years ago?).
This release sees the ability to take open source & packaged visualisations and libraries such as D3, HighCharts, iCharts etc and integrate them into Cognos Analytics as a custom visualisation. This version ships several custom samples such as the infamous Sankey diagram so you can explore these customisations and test them against your own data or requirements.
- Custom visualizations can be uploaded directly from Reporting and dashboarding for reuse;
- Developers can preview and test custom visualizations live within Cognos Analytics before uploading;
- Administrators can set permission on custom visualizations for access control;
- Additional properties can be included as part of the custom visualization.
Dashboarding
In addition to the new custom visualization mentioned above, this release offers a lot of enhanced dashboarding features that users can take advantage of. In this release we see a huge improvement to crosstab support, with more finely grained controls of what is possible within your crosstabs. You can now control the sizing of rows and columns as well as format the style such as fonts, colours etc. OLAP databases also now support null suppression which again helps keep your crosstabs clean and tidy.
There is also a new KPI dashboard object that allows you to take two similar measures and compare them in terms of trends and behaviours.
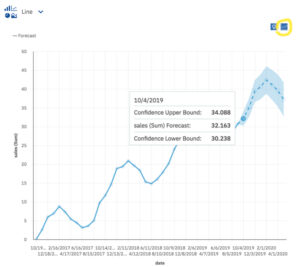
The highlighted feature (in our opinion) is the forecasting feature on line and bar charts. In previous releases you could turn on/off insights on these chart types or use the new Jupyter notebook support to produce this forecast, but in this release you can now enable a forecasted view of your data in one click, and see a forecasted set of values based on historical data patterns directly within your dashboard.
Explorations
The exploration starting points page which has been enhanced to get users started with several interesting starting points to explore, or can allow them to dive straight into compare mode, which also provides a number of interesting comparisons of relevant data points.
AI Assistant
The previous release introduced to the ability to ‘create dashboard’ which would build a starting dashboard against your data, designed to showcase the smarter insights gained from your data. This has been improved to allow for additional filters and more refined visualisation building. Users can, via conversation, introduce categorical filters which will allow Cognos Analytics to use its smart engine to determine which column to filter.
Reporting
Report authors can now use the custom visualisations (mentioned above) inside their production reports and can incorporate results from the Jupyter notebook integration inside any schedule and production reports being created.
The ability to compact or resize the legend bar for charts using large data sets is now available in reporting and dashboarding and can save valuable screen and report space.
Stories
You can now export stories to .pdf, which better allows users to tell and share the narrative of their data.
Access to Weather-Related Data
New IBM Weather Company data source is now available for organisations looking to incorporate historical weather-related data with their own data into Cognos Analytics dashboards, stories, reports, explorations (requires a separate subscription).
What’s Next?
Read our press release to see a full list of all the new and changed features in Cognos Analytics 11.1.4.
NewIntelligence constantly strives to ensure that all our Cognos and SAP B1 QuickStart customers are up-to-date and on the latest and greatest versions of Cognos Analytics (BI). We are now booking migrations to v11 for those customers who have not yet migrated to the latest version. If you’re still running version 10.x of Cognos BI, we trust that you are aware that it is no longer supported by IBM (it will continue to work but will not be enhanced or supported in full by IBM).
It’s important to keep up-to-date with the latest versions of IBM Cognos software in order to maximize on your investment, and to allow us to optimally serve and support you in the most efficient manner. Additionally, by being on the latest release, you’ll have access to an improved interface, enhanced features, and better performance. However, knowing which version is the right one for you – or when to make that important upgrade – can be a challenge.
Our IBM Cognos Analytics experts will work with you to ensure you have the right version installed for your company. Contact us today for a no-obligation consultation.


