
Being in the data analytics business for several years now, we’ve talked to a lot of companies. Most organizations, regardless of their size, generate a deluge of data every day. Data that they need to make critical decisions about their business that they struggle to access, for various reasons. So, a lot of the companies we speak to often need a data analytics solution and they don’t even know it yet. This leads to the question: How does one know that their company needs a data analytics solution?
We have established the top four most recognizable signs a company needs an analytics solution to help extract the information they need from their data in order to make strategic decisions and improve the company’s bottom line.
1 – Data, data everywhere (and none that you can act on)
Most companies have a wealth of data, but it is usually stored in multiple different sources. If a company cannot access their data, they can’t analyze it and therefore cannot derive any conclusions from it. Many companies rely on their IT department to generate custom reports, which end up not providing enough insight into historical data or to get a complete picture of how their company is doing. This in turn leads to making inaccurate decisions based on gut-feeling versus facts.
Data analytics provides the ability to access your company’s data and analyze it in-depth using different metrics. This in turn gives you a 360-degree view of how your business is doing, leading to actionable insights to make smarter decisions.
2 – Delayed & outdated reports
Most companies must rely on IT to generate custom reports, which can become time-consuming, and often frustrating. Though static reports offer important information at a high-level, they often don’t provide much in terms of detail. Plus, by the time managers receive these reports, they are often outdated and hence not relevant or valid if there were delays in outputting them.
Though an analytics solution still provides high-level summary reports, it allows for much more sophisticated reports that are more detailed and dynamic. Users can drill through interactive reports with just a few clicks to delve deeper into the information that these reports are built on. A sales report can therefore not only show a sales manager how their reps are performing but allows them to see which ones are exceeding their targets and which ones are not meeting expectations.
3 – Excel no longer does it for you
Most companies store their data in multiple sources such as ERP and CRM systems. Therefore, in order to analyze data from these multiple sources, it is typically manually imported into spreadsheets. This process is time-consuming and prone to errors, as one wrong element in formula can invalidate an entire report. Several versions of the same report can exist, and security can be an issue as well if the data contained in the spreadsheet gets shared via email or USB key. Since spreadsheet analysis ends up usually becoming a lengthy process, delays in analysis of time-sensitive data leads to making unreliable and ill-timed decisions.
If your company’s analytics needs are no longer met by Excel, it is time to consider a business intelligence (BI) solution like IBM Cognos Analytics. This solution pulls all your data together from its different sources and stores it in one central location, providing you with ‘one version of the truth’. Your data can therefore be analysed and reported on in real time, eliminating any chance for error. Cognos allows you to set user security permissions so access can be adjusted to the employee’s role.
4 – No at-a-glance view of the company as a whole
Without being able to see key performance indicators (KPI’s), it is nearly impossible for managers to make critical decisions. Management personnel need access to such metrics as sales statistics, supply chain data, and cost analyses without having to look for data in multiple places or wait for reports to be produced.
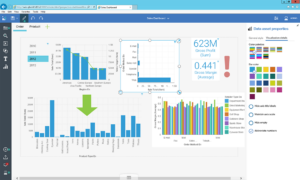
A good data analytics solution provides all users at all levels in the organization with not only an at-a-glance overview of key metrics, but a dynamic, interactive visual representation of actual current data that can be drilled down on. Data in a dashboard can be represented in both numerical and graphical formats and can be customized by users to present whatever information they want to analyze and derive trends from.
After reading this article, do you recognize your company experiencing some or all the above-mentioned signs when it comes to accessing, extracting and analyzing your data in order to derive actionable insights to make informed decisions? Then it is time to think about acquiring an analytics solution, because, guess what, you do indeed need one!
As an IBM Business Partner, NewIntelligence can show you why Cognos Analytics is the best fit for your organization. In addition, we can accompany you on your BI journey and help you implement your analytics solution with our tried and tested methodology according to best practices and ensure your users are trained and ready to start using all the available functionality that this analytics solution will provide them.
Take the first step in your analytics journey and contact us today for a complementary, no obligation consultation.
