
Many small-to-medium businesses we speak to initially think they don’t ‘need’ dashboarding an tend to feel that it would be a ‘nice-to-have. These companies typically don’t think of dashboarding as something worth investing time and money in. Some of these companies tend to focus more on reporting and do use tools like Excel to extract and report on their data. However, these businesses seem to place little importance on dashboarding, often thinking of it is just a ‘prettier way’ to look at their data. Still other organizations we have encountered have no idea what a dashboard is.
What is a dashboard?
A dashboard is a comprehensive snapshot of your company’s performance. Because the nature of a dashboard is dynamic, one can click on any area of performance and ‘drill-down’ to see more details. The function of a dashboard is to provide reliable results by aggregating and extracting value from all the data collected in your datawarehouse, otherwise known as your key performance indicators (KPIs). It simplifies your data into more manageable chunks of visual information that allows you to see what you are doing right and where you need to improve. Dashboards can be used to help business managers make informed decisions that dramatically impact business performance – which in turn effects their bottom line.
Why use dashboards? What is their purpose for an organization in terms of data visualization?
The dashboarding software can help your organization:
- Make decisions based on facts and on current data that is periodically refreshed daily;
- Make your data more valuable by giving every organization member the opportunity to gain insights that help them perform their job better;
- Save time and frustration by having all your data analytics on one screen, instead of flipping between screens, digging through databases, or signing into multiple analytics applications;
- Get an easy to understand, objective view of current performance that will effectively serve as a foundation for further dialogue and surface metrics that are relevant to each team in a way that is mutually understandable;
- Get an at-a-glance big picture of every important metric needed to make informed decisions, including metrics and key performance indicators from multiple data sources, markets and departments;
- Get insight into possible problem areas so stakeholders can handle challenges proactively.
Why isn’t reporting enough to make decisions on data?
If you want to compare dashboards to reports, reports are text-based, whereas dashboards are visual. Simply put, the information in a dashboard is easier to consume than a report, because we understand information presented to us through visuals more quickly and easily than through a page of text.
What’s the best way to incorporate dashboarding into my company’s reporting procedures?
NewIntelligence helps companies get smarter analytics by working hand in hand with management and key company resource implement business intelligence software to their ERP, or any other data sources, which syncs all the data into a single source of truth.
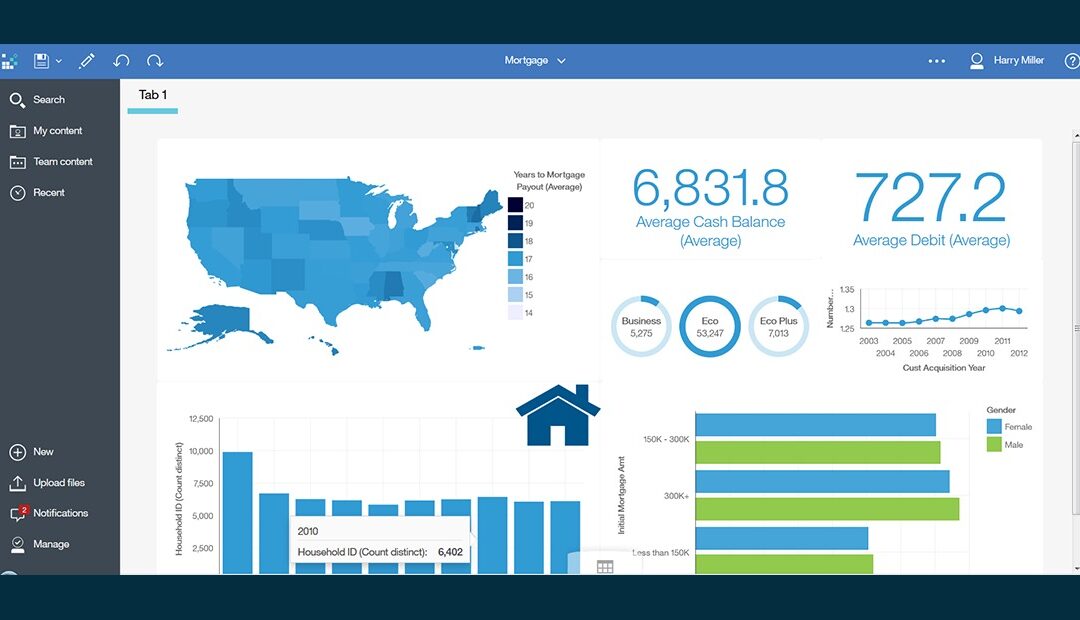
Business intelligence software such as IBM Cognos Analytics helps users uncover the data insights that drives their business and present the findings in dashboards, that can be easily built to meet the needs of your business.
How easy it is to build dashboards?
You don’t need to be technical to create a powerful dashboard in Cognos Analytics. Users work in a portal environment which is browser-based; therefore, no additional software has to be installed on the user’s computer or device.
You can create as many dashboards as you like, customize them and share them with other users. There are several ways to change the look and feel of a dashboard. Most of this customization can be done either while you are building a dashboard, or with an existing dashboard.
You can set your dashboard to update with any new data, either immediately or at selected intervals.
With access any time to the current data you need that a good dashboarding software can provide you, you can make the best strategic, tactical, and operational decisions for your business.
Stay tuned for our next blog where you can see how easy it is to build a dashboard in IBM Cognos Analytics. We will show you a step-by-step guide how to create your own dashboards without the need for IT intervention with just a few clicks. In the meanwhile, click on the button below to take a look at this short demo on Quick Dashboard Creation with Cognos Analytics.