In these rapidly changing times, we all need access to data that is current in order to make better informed decisions. With the news on what is happening in terms of social distancing policies and other changes everyone’s daily practices all over the globe changing hour to hour, it is difficult to not feel overwhelmed by this deluge of information.
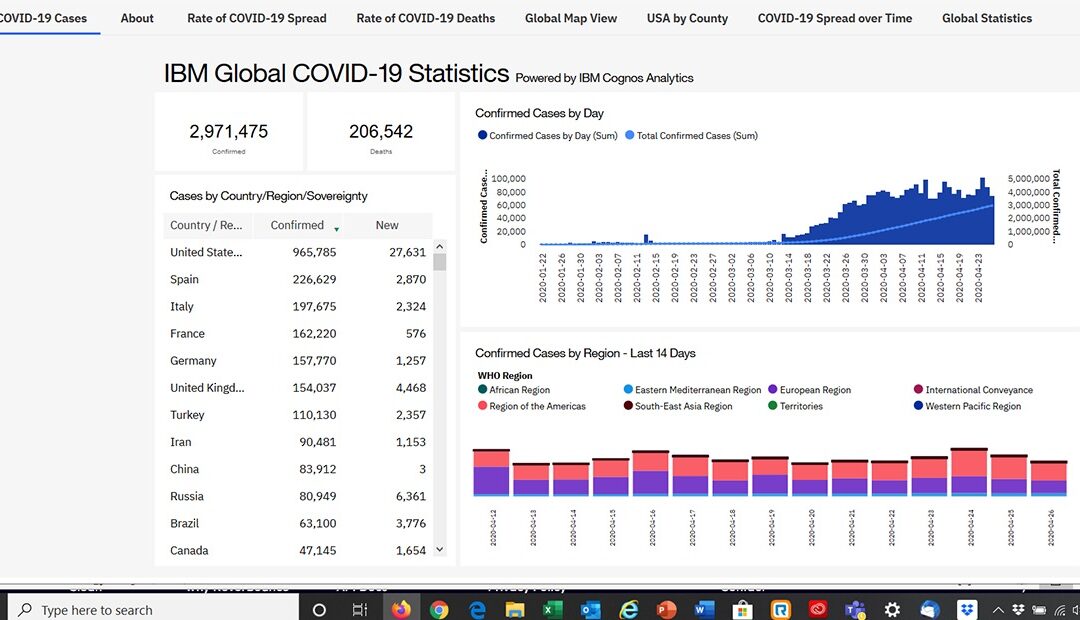
IBM has made it easier for people around the world to stay up to date on COVID-19 in their vicinity as demand for the latest news and statistics surges week-to-week. IBM has developed a new, interactive global dashboard driven by IBM Watson and built on IBM Cognos Analytics to show the spread of COVID-19 across the world. This dashboard is designed to help users such as data scientists, researchers, media organizations and more conduct a deeper analysis and filtering of regional data. Available global data includes confirmed cases, recoveries where available and more, and users can drill down to the country, region, state and county level as needed to get further insights. This aggregated data could potentially help others collect insights and show how cases are trending over time.
The COVID-19 data reflected in this dashboard is pulled from state and local governments and the World Health Organization. The team at IBM have made the dashboard freely available to all and no email is required – simply click below to explore the dashboard.
In addition to the data the dashboard provides, it also offers multiple ways to summarize data. For example, users can view statistics on active cases, deaths and recovered patients by country; number of cases by region; and historical trends. IBM is also considering developing additional tools for researchers.
Alongside the Cognos COVID-19 dashboard, IBM has developed an Incidents Map on the IBM Weather Channel app and weather.com. The Incidents Map provides data on COVID-19 cases by state, as well as county-level data. You can simply type in the city or zip/postal code you want the data on and get trusted, up-to-date information on the latest COVID-19 data with AI from Watson.
Created in less than a week last month, the Incidents Map and Cognos COVID-19 dashboard are the result of extensive IBM teamwork and are in keeping with a key IBM objective: providing trusted information for all.
Both tools produced by IBM and The Weather Channel ensure that researchers, scientists and the general public are kept informed, without the associated risks posed by cybercriminals and inaccurate reporting sources.
Experts from throughout the company collaborated around the clock using agile development methods while working from home. Instead of gathering around a whiteboard, developers and other experts worked remotely, using IBM digital collaboration tools and teleconferencing.
Read more about the Incidents Map and Cognos COVID-19 dashboard here.
Find out more about how you can build your own dashboards with IBM Cognos Analytics.


