IBM released Cognos Analytics 11.1.6 in April 2020. Here is a list of new and changed features in this new release.
Getting Started
Ask for help in the cognitive Learn Pane – cognitive help tailors your question to where you are working and finds only the answers that are relevant to you.
New Carbon Design icons – provides a consistent user experience across IBM products.
Dashboards
Expand crosstab hierarchies (also available in Stories) – If are using an OLAP data source, you can expand crosstab hierarchies to display nested children.
Fields pane (also available in Stories) – On the toolbar, open the Fields pane to add columns to build and modify visualizations. Add a column to each mandatory field in the Fields pane. You no longer have to expand each individual visualization to make changes.
Visualization toolbar is docked at the top of a dashboard (by default) – You can undock the toolbar so that it is attached to a selected visualization.
Changed dashboard reset experience
Customize unit labels on a measure (also available in Stories)
Focus mode (also available in Stories) – use to maximize the size of a visualization to quickly review chart content.
Guided dashboard creation (also available in Explorations) – From the embedded assistant, you can now generate a dashboard based on specified fields of interest. Introduced in version 11.1.4 as a two-step process. After generating a set of charts for selected fields/columns, a Create dashboard from the charts option was provided. Beginning in version 11.1.6, you can guide dashboard creation by including context and field information.
Use AI to personalize recommended visualizations (also available in Stories, Explorations) – IBM Cognos Analytics recommends particular visualization types based on your selected data. With AI learning, your usage and preferences are used in subsequent recommendations to provide a more personalized experience.
Stand-alone calculations with AI and advanced analytics features now supported (also available in Stories) – including relationship diagram in Explore, and the decision tree, spiral, and driver analysis visualizations.
Support for categorical coloring in a map visualization (also available in Stories, Explorations, Reporting) – by dragging categorical data to the Location color field. A warning is displayed when there are multiple color items for a single location.
Map rendering when data contains invalid latitude or longitude (also available in Stories, Explorations, Reporting) – As of this version, Cognos Analytics does not display the data point on the map at all versus remapping the coordinate to [0,0]. In this version, the legend is updated to reflect a removed data point and add a warning message if the domain in the legend changes.
Explorations
Natural language details for time series – When time fields and a measure field are specified in the visualization and a forecasting model is computed, detected time series insights become available under the Details tab.
Reporting
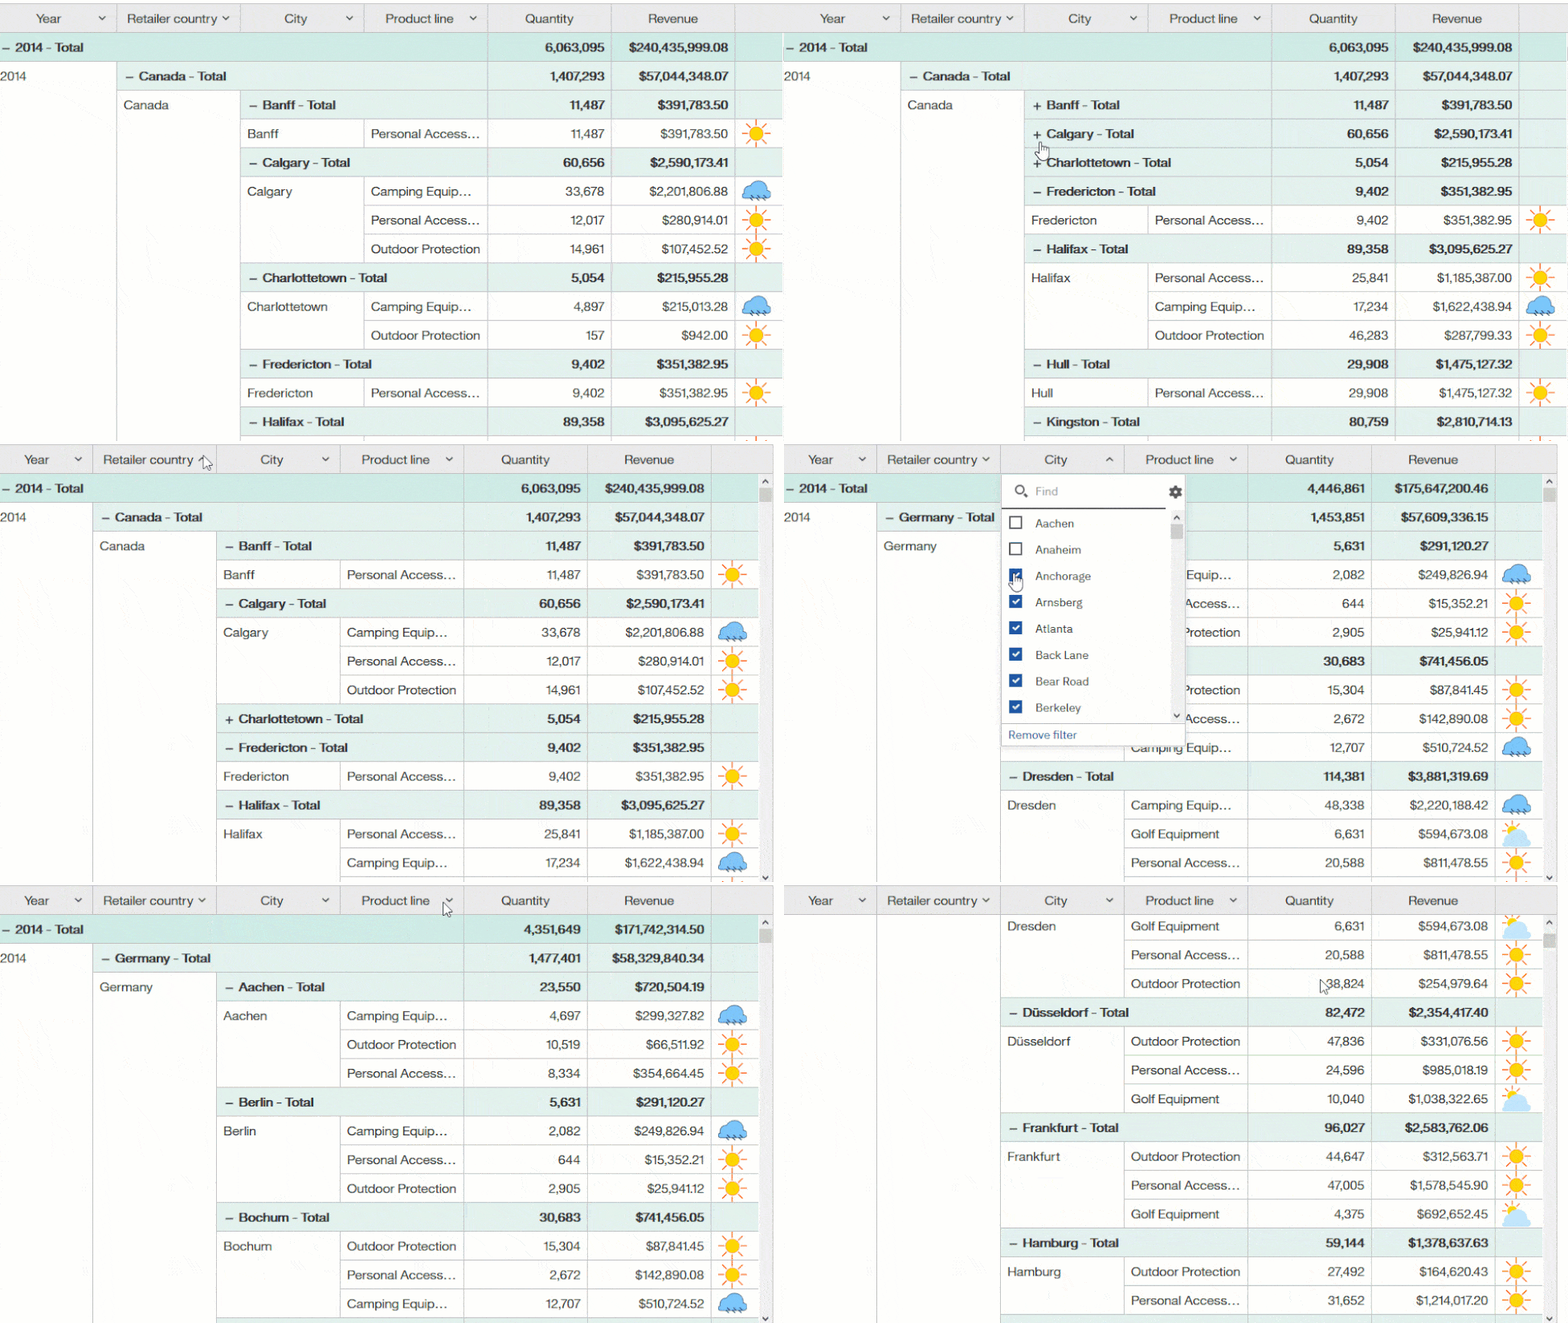
Data tables – a new type of data container in Cognos® Analytics reports, similar to lists because they also show data in rows and columns. However, unlike in lists, the data is rendered on the browser side, and not on the Cognos Analytics server side. As a result, the data in data tables is displayed very quickly. You can group and summarize data in data table columns, expand and collapse rows, apply filters to columns, and add custom indicators instead of numbers in measure columns.
Drilling up and down in a visualization in a report
Comparing measures in a visualization – by adding multiple measures on the Length slot.
Modelling
• Add individual columns to a data module – without having to update whole table
• Show unused items – to highlight the columns that are not in the data module.
• Reload metadata – to identify potential discrepancies between the data in the source and the data module.
Framework Manager model update utility – can be used with model files that were created or updated in IBM Cognos Framework Manager 11.x or earlier versions.
Administration
Enhanced Analytics User license – As of IBM Cognos Analytics release 11.1.6, anyone who is assigned the Analytics User license can create explorations.
SQL Server 2019 – is now supported as of 11.1.6.
For full details on the new enhancements to the latest version of Cognos Analytics, read our recent blog.
Contact NewIntelligence today for more information on migrating to version 11.1.6.

