Create Comparative Views by Salesperson

Create Comparative Views by Salesperson

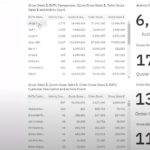
Want to see how your sales teams’ efforts are translating into revenue? Watch live demo from our latest webinar “Measure the Direct Impact of Your Sales Activities on Your Revenue” with QuickStart for SAP B1. Watch as NewIntelligence President, Corey Mendelsohn shows you how calls, emails, and various touchpoints from your teams impact quotes and orders.
Create Dashboards to View the Impact of Sales Activities on Your Revenue

Create Dashboards to View the Impact of Sales Activities on Your Revenue

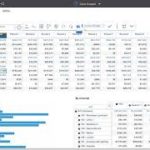
Want to see how your sales teams’ efforts are translating into revenue? Watch live demo from our latest webinar “Measure the Direct Impact of Your Sales Activities on Your Revenue” with QuickStart for SAP B1. Watch as NewIntelligence President, Corey Mendelsohn shows you how calls, emails, and various touchpoints from your teams impact quotes and orders.
Exploring GL Income Statement and Balance Sheet Information in Excel with NI’s SAP B1 Quickstart

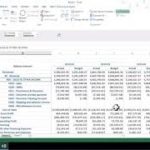
This demo shows how you can explore GL income statement and balance sheet information in Excel such as GL Periods, Chart of Accounts, Versions (Actual versus Budget) and GL measures using our SAP B1 QuickStart solution and our new Financial Reporting add-on module. It demonstrates how to create an exploration in Excel with income statement information that allows you to see actual versus budget by period and drill down on revenue down...