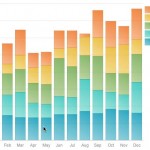
A Visualization is Worth a Thousand Tables : How IBM Business Analytics Lets Users See Big Data

Too often, organizations must resort to presenting data in summary tables and generating graphs and charts with spreadsheet applications. As business data gives way to big data, these approaches are increasingly inadequate and fail to produce useful, accessible views of data. IBM has several solutions that let technical and non-technical users alike dispense with ineffective, legacy approaches and intuitively explore and visualize...

From Scorekeepers to Business Partners – the Evolving Role of Finance

From Scorekeepers to Business Partners – the Evolving Role of Finance

Leading finance organizations have been expanding from traditional historical reporting and “scorekeeping” functions to a broader role that supports the enterprise with valuable business insights. From Scorekeepers to Business Partners-the Evolving Role of Finance

ROI When Deploying Analytics : New Research Shows Analtyics Pays Back $13.01 on every dollar spent

Organizations are continuing to make investments in analytics to meet the growing demands of the user community for more robust and usable analytic solutions. In analyzing Nucleus ROI case studies on analytics, we found the average returns from analytics have been increasing, reaching $13.01 for every dollar spent in 2014 from just $10.66 in 2011. Nucleus research ROI Sep 2014

Why Smarter Business Begins with Better Reporting Tools

This paper describes the current state of BI reporting, significant trends shaping the industry, and ways in which IBM Cognos Business Intelligence satisfies challenging requirements in demanding, heterogeneous environments.